In its weekly storage report released this past Thursday, the EIA reported that working natural gas in storage decreased by 118 BCF to 2684 BCF. The withdrawal was 47 BCF less than the five-year mean withdrawal of 165 BCF, but 24 BCF greater than last year's ugly 94 BCF draw. Inventories now stand 226 BCF greater than this time last year, but climbed to 351 BCF, or 15% greater than the five-year mean. The withdrawal number came in well below the analyst consensus of a 132 BCF withdrawal and my own projection of a 135 BCF withdrawal. This was the second consecutive withdrawal to badly miss analyst estimates to the downside. While prices surprisingly weathered last week's big miss, following this Thursday's number, natural gas tumbled 4% one day after reaching a fresh 2-week high. The commodity slid a further 1% on Friday to close at $3.28/MMBTU.
Part A: Meteorological And Supply-Demand Discussion
What follows below is a 2-part discussion beginning with a week-by-week meteorological discussion and, by extension, supply-demand analysis, of the next 5 storage weeks, which utilizes a storage model I developed to project weekly natural gas withdrawals through the week ending March 8. This is followed by a natural gas price analysis in which these numbers are integrated into a fundamental pricing model to estimate the extent to which the 5-week supply-demand picture is priced into the commodity and therefore, determine whether natural gas is over or under-valued at current levels.
Summary: Storage Projections For Next Five EIA Storage Reports |
||
|---|---|---|
| Storage Week | Weekly Withdrawal Projection (BCF) | Departure From 5-Yr Mean |
| February 2-8 | -153 | +1 |
| February 9-15 | -132 | +8 |
| February 16-22 | -143 | -25 |
| February 23-March 1 | -97 | +10 |
| March 2-8 | -92 | -18 |
(Complete) Week of February 2-8
After last week's bearish withdrawal number, I am projecting a return to near average natural gas demand in this week's storage report with an estimated 153 BCF withdrawal, 1 BCF less than the five-year mean withdrawal of -154 BCF. The projected estimate trended smaller by 8 BCF compared to the 161 BCF estimated in last week's discussion. Over the last 3 weeks that I have been issuing projections for this storage week, the projection has trended generally towards a smaller withdrawal, as seen on the left-hand graph below.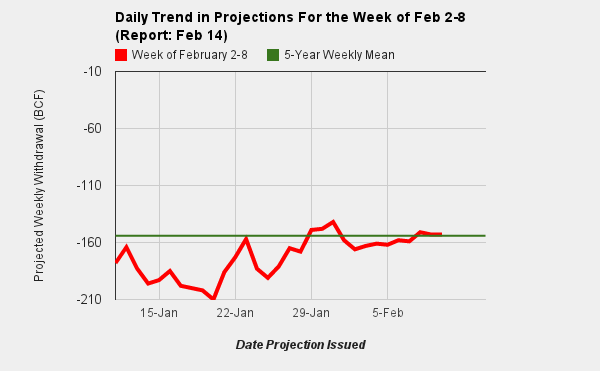
Very cold temperatures at the beginning of the storage week with daily withdrawals of 25-28 BCF moderated with withdrawals falling below average by Tuesday, and remaining at or below average for the remainder of the week. The EIA noted that residential/commercial demand rose by an estimate 9.8% compared to the previous week through Wednesday due largely to the colder weather and associated heating demand. Powerburn for electricity generation also rose by 7.5%, and industrial demand rose by 1.6%. Early analyst guidance for the projection covers a wide range between -128 BCF and -180 BCF. Whatever the precise number, the spread between storage this year versus last year will continue to widen given last year's bearish 113 BCF withdrawal. As some actual storage and pipeline data is integrated into my model early this week, it is possible that my projection may change slightly prior to Thursday's Report. I update all statistics daily on my website, Powerburn.blogspot.com, and will also make a note in the comment sections here on Wednesday regarding a final estimate.
Week Of February 9-15
An active, amplified weather pattern will dominate the nation this week. A complex storm system, dubbed "Orko" by the Weather Channel, brought blizzard conditions to the northern plains and tornadoes to the Southeast on Sunday. The storm will weaken and track northeast into Canada and should not bring significant cold air southward. A second storm system will spin up across the Southeast on Tuesday, bringing flooding rains to several states before slowly tracking northeast by the end of the week. The storm is currently expected to track off the Mid-Atlantic Coast, possibly dealing a glancing blow to New England, but also without bringing any significant cold air southward. With the absence of any arctic invasions, daily withdrawals will slowly drift downward this week from 20-25 BCF/day over the weekend in Winter Storm "Nemo's" wake, to 14-18 BCF by the second half of the week, below the five-year mean daily withdrawal of 19 BCF/day. Over the last 48 hours, this week's temperature forecast has been trending warmer, particularly for the first part of the week. This should result in a near-average weekly withdrawal. For the week of February 9-15, my model is projecting a net withdrawal of -132 BCF, 8 BCF less than the five-year mean withdrawal of -140 BCF. The estimate trended towards a smaller withdrawal by 8 BCF compared to the 140 BCF estimated in last week's discussion. By comparison, this week last year saw a 166 BCF withdrawal, the second largest of the season and the last above average withdrawal for the next 8 weeks, a span during which time natural gas prices tumbled to decade lows of $1.90/MMBTU.
Week of February 16-22
Colder air will spread southward over the President's Day weekend, increasing heating demand across a large portion of the eastern half of the nation. A cold front will slide south and east on Thursday and Friday of this week with mean temperatures 15-20 degrees below average by Monday, February 18, with the core of the coldest air centered across the Midwest. Daily withdrawals may rise as high as 24-28 BCF by the end of the weekend and early next week.
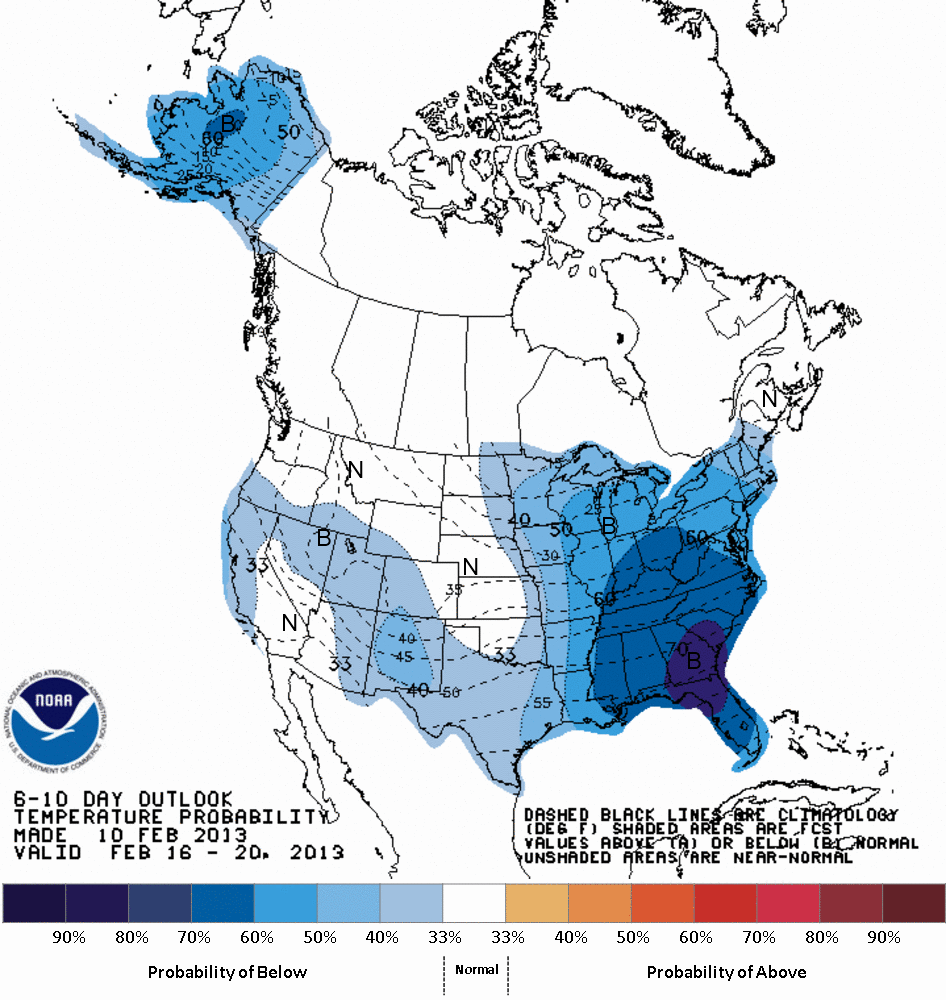
Monday morning looks particularly cold, especially across the South, with a possible threat to the Florida citrus crop. Temperatures will moderate slowly during the course of the week as the coldest air shifts eastward with withdrawals approaching the daily mean withdrawal of -17 BCF during the second half of the week, although there are indications in the models that a reinforcing shot may settle south by the end of the week. Like the previous week, forecasts have been trending slightly warmer over the last 48 hours. For the week of February 16-22, my model is projecting a weekly withdrawal of -143 BCF, a respectable 25 BCF greater than the five-year mean withdrawal of -118 BCF. By comparison, last year saw an ugly 82 BCF withdrawal.
Extended Forecast: Weeks Of February 23-March 1 & March 2-8
Temperatures currently look to moderate during the final week of February, with above average readings across most of the eastern half of the nation. My model is projecting a net withdrawal of 97 BCF for the week of February 23-March 1, 10 BCF less than the five-year mean withdrawal of 107 BCF. 
For the first week of March, some of the extended models are suggesting that a colder airmass may shift south and eastward from the Rockies, bringing near-to-below average temperatures to much of the nation. For the week of March 2-8, my model is currently projecting a net withdrawal of -92 BCF, 18 BCF greater than the five-year mean withdrawal of -74 BCF. Based on the five-year mean withdrawals, the first week of March is the penultimate week of the withdrawal season, with demand dropping off rapidly in subsequent weeks. It should be noted that temperature projections beyond 10-14 days are at the edge of current forecasting capability, and are subject to considerable volatility and revision. However, due to the forward-looking nature of the commodities markets, they are included in my projections.
Summary
For the period of February 2-March 8, my model is projecting that the current storage surplus will contract by 24 BCF, from +351 BCF to +327 BCF.

However, due to recent underwhelming draws, it is becoming less and less likely that we will finish the season below 2000 BCF in storage. Should the above projections verify and the final seasonal withdrawal a week later track the five-year mean of -26 BCF, my model is projecting season-ending working gas in storage of 2041 BCF. While this is a substantial improvement upon last year's record high 2369 BCF, it is 19% greater than the five-year mean of 1714 BCF. Because these forecasts are based on temperature and weather forecasts, they are subject to change during the course of the week. I do all of my projections and statistics daily and provide discussions similar to this one on my site, Powerburn.blogspot.com (see direct link in my pProfile).
Part B: Natural Gas Pricing Discussion
Natural Gas Pricing And Fundamental Discussion
Based on a fair pricing model I developed, natural gas is trading at small premiums when both current storage alone as well as three- and five-week projections are considered. This fair pricing model uses 12 month pricing trends to calculate a neutral "fair price" for natural gas. Current prices may be compared to this price and described as undervalued, overvalued, or fairly valued. The Fair Value is not a "target price" per se, but the spread between this value and the current price indicates to what extent investors are pricing in both the current supply/demand status, as well as 3- and 5- week anticipated changes in supply/demand.
| Fundamental Pricing Model | ||||
|---|---|---|---|---|
| Fair Price | Last Price | Spread | Summary | |
| Current Storage Only | $3.19 | $3.28 | +.09 | Overvalued |
| Current Storage + 3 Week Projections | $3.24 | $3.34 | +.10 | Overvalued |
| Current Storage + 5 Week Projections | $3.26 | $3.34 | +.08 | Overvalued |
When current storage alone is considered, the commodity is trading at a 9 cent premium to a fair price of $3.19/MMBTU. When higher confidence 3-week projections and comprehensive but lower confidence 5-week projections are integrated into the model, natural gas is trading at premiums of 10 and 8 cents, respectively. These relatively small premiums suggests that investors overall are expressing moderate confidence that forecasts will remain constant or trend slightly colder, or other fundamental driving forces will present themselves in the next 4 weeks.
With a series of near-average withdrawals expected and a narrow 7 cent spread between fair prices based on current storage and 5-week projected storage, I continue to expect relatively low volatility, consistent with my discussion from last week. Over the last month, prices have made a series of higher lows and lower highs. After reaching a low of $3.09/MMBTU January 10, natural gas surged to $3.62/MMBTU 12 days later. 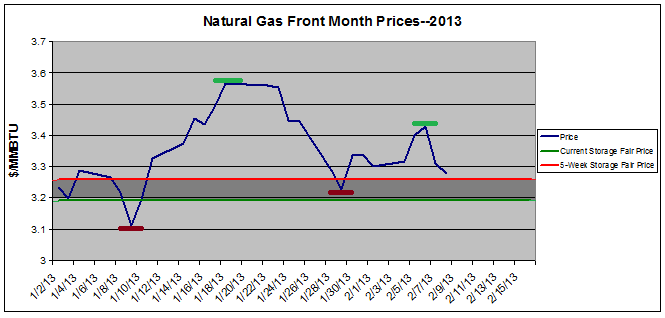
The commodity then pulled back to a higher low of $3.14/MMBTU on January 29, followed by a lower high of $3.40 last Wednesday. I expect this contraction to continue with some oscillation between $3.20 and $3.35 with a slow trend lower as the end of the withdrawal season approaches. I continue to expect that prices will remain above $3.00/MMBTU through at least mid-March. I will begin to unwind my short hedges, accumulated over the past two weeks -- primarily of DGAZ -- which currently make up 10% of my holdings if and when prices fall below $3.25. I will continue holding my long-term long positions -- including UNG, UGAZ, CHK, SD, and SWN, among others -- for the foreseeable future. I will consider adding to my positions should the commodity drop below $3.10/MMBTU.
Additional disclosure: I have no plans to initiate additional long or short positions in the next 72 hours. All projections and fundamental pricing models are released by Powerburn as experimental products and are not affiliated with nor endorsed by the EIA. While they are intended to provide accurate, up-to-date data, they should not be used alone in making investment decisions, or decisions of any kind. Powerburn does not make an express or implied warranty of any kind regarding the data information including, without limitation, any warranty of merchantability